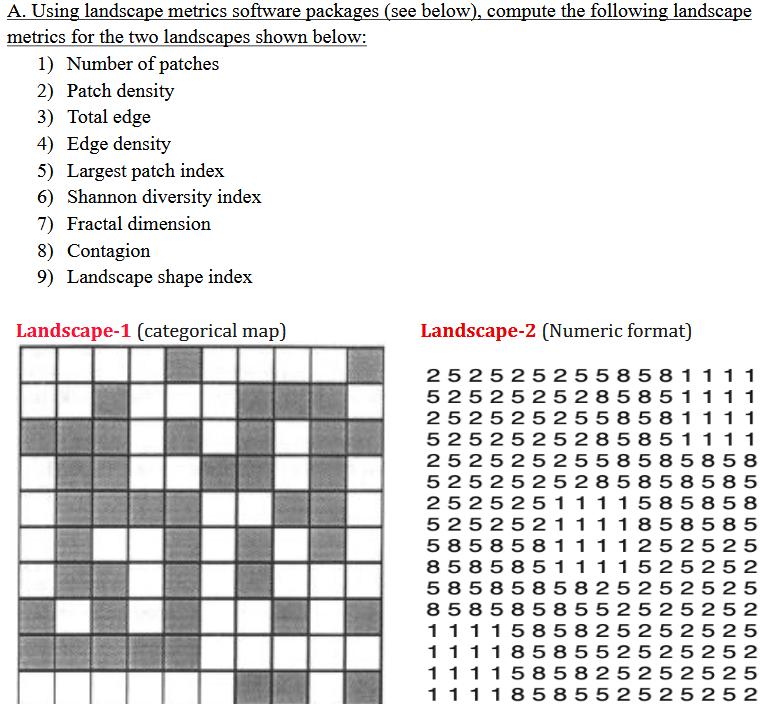
I have learned a lot during my time in Landscape Ecology. This class was nothing like I expected in the best way possible. To earn extra credit, Dr. Wu provided the below assignment:
In order to achieve these goals, I implemented the below code.
library(landscapemetrics)
library(terra)
library(tidyverse)
#input landscape data
land1mat <- matrix(c(
0,0,0,0,1,0,0,0,0,1,
0,0,1,0,0,0,1,1,1,0,
1,1,1,0,1,0,1,0,1,1,
0,1,1,0,0,1,1,0,1,0,
0,1,1,1,1,0,0,1,1,0,
0,1,0,0,1,0,1,0,1,0,
0,1,1,0,1,0,1,0,0,0,
1,0,1,0,1,0,0,1,0,1,
1,1,1,1,1,0,0,0,0,0,
0,0,0,0,0,0,1,1,0,1
), nrow = 10, byrow = TRUE)
#format into raster
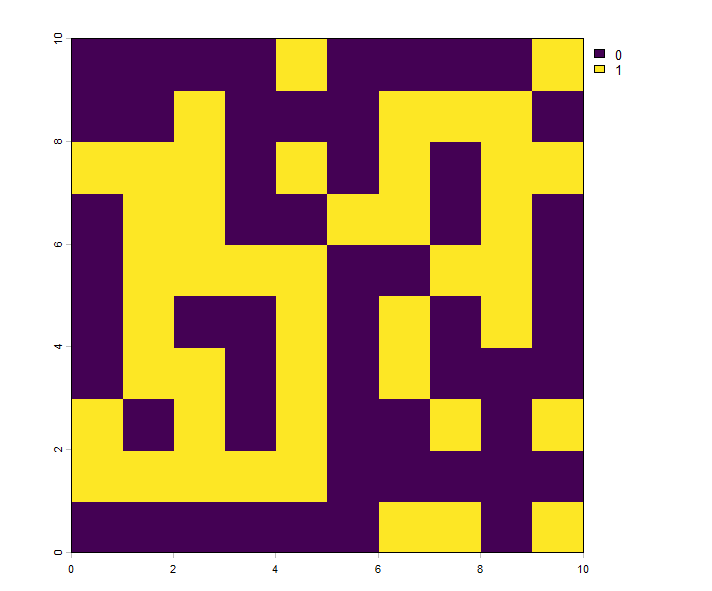
land1<- rast(land1mat)
#list needed metrics
wanted_metrics <- c(
"lsm_l_np",
"lsm_l_pd",
"lsm_l_te",
"lsm_l_ed",
"lsm_l_lpi",
"lsm_l_shdi",
"lsm_l_fractal_am",
"lsm_l_contag",
"lsm_l_lsi"
)
#calculate and format output
metrics <- calculate_lsm(land1, what = wanted_metrics)
metrics$layer <- NULL
metrics$level <- NULL
metrics$class <- NULL
metrics$id <- NULL
metrics$metric <- c("Contagion",
"Edge Density",
"Largest Patch Index",
"Landscape Shape Index",
"Number of Patches",
"Patch Density",
"Shannon Diversity Index",
"Total Edge"
)
#print metrics and the plot
metrics |>
mutate(value = format(value, scientific = FALSE)) |>
print()
plot(land1)
This code generated:
1 Contagion               "    0.3467216"
2 Edge Density            " 9200.0000000"
3 Largest Patch Index     "   46.0000000"
4 Landscape Shape Index   "    3.3000000"
5 Number of Patches       "    8.0000000"
6 Patch Density           "80000.0000000"
7 Shannon Diversity Index "    0.6881388"
8 Total Edge              "   92.0000000"
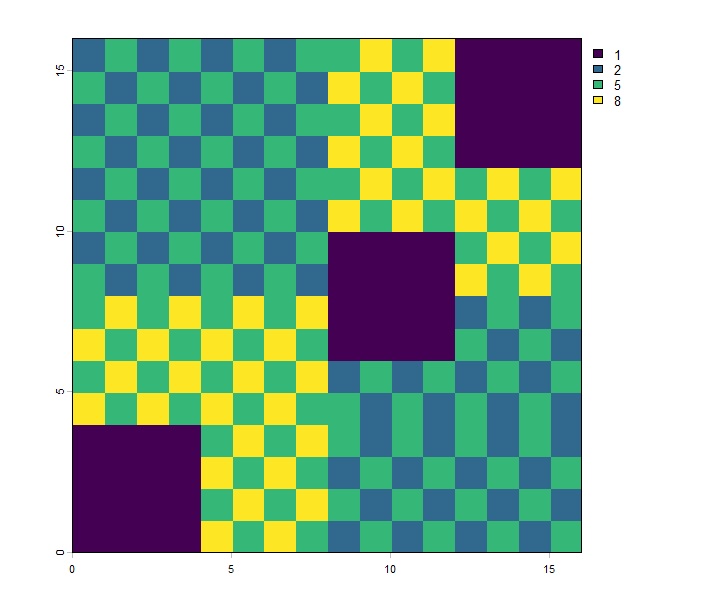
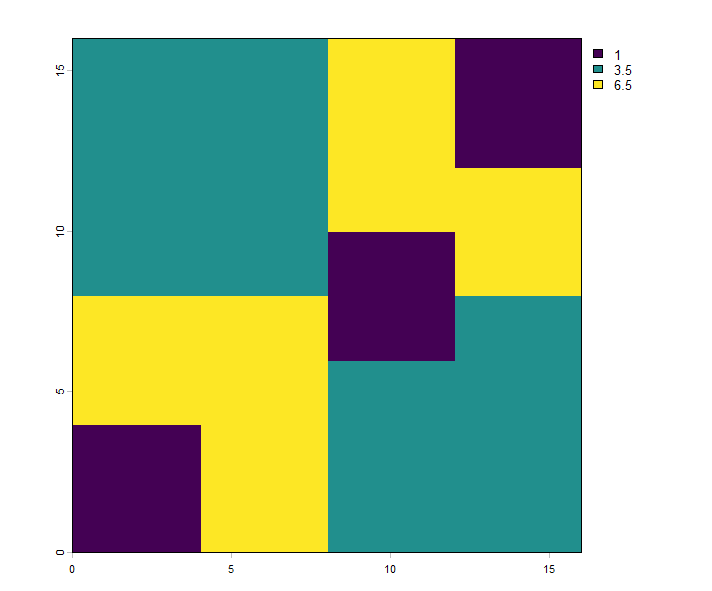
The second landscape also needed to be aggregated. This was done easily through adding
land2ag <- aggregate(land2, fact = 2)
into the already existing code.
This lead to the results looking like:
1 Contagion               "   21.543837"
2 Edge Density            " 2187.500000"
3 Largest Patch Index     "   25.000000"
4 Landscape Shape Index   "    1.875000"
5 Number of Patches       "    7.000000"
6 Patch Density           "27343.750000"
7 Shannon Diversity Index "    1.036106"
8 Total Edge              "   56.000000"
This worksheet was very interesting and challegned me to use skills I would otherwise not practice on my own. I believe that the skills learned here can be very valuable in any setting where the composition and configuration of some- thing need to be compared.